
Photo: arsenal.com
22 years is a long time in football. Long enough for an entire generation of supporters to grow up without seeing their club lift the Premier League trophy. Long enough for every promising season to be measured against the weight of past disappointments.
Over time, Arsenal acquired an unwanted label: bottlers; a team capable of playing brilliant football but unable to deliver when the stakes were highest. Every dropped point became evidence. Every title challenge that faded reinforced the belief that Arsenal lacked the mentality required to win the League.
With each passing year, the questions only grew louder. When the pressure rises, when injuries mount, when the title race becomes a test of resilience rather than talent, can Arsenal endure? Can they stay the course? Can they finally prove they have what champions are made of?
Now we know.
Arsenal are champions of England, again. But the most interesting thing about this title is not simply that it happened. It is the way it happened.
This was not one of those title wins that arrives with its own ready made myth. Leicester's 2015-16 side had the impossible dream. Pep Guardiola's best Manchester City teams had the aura of inevitability, the sense that they would pin you in and drain the life out of a game until resistance felt pointless.
Arsenal's 2025-26 season was different.
The most important thing about Arsenal's title-winning season was that there was no single thing that explained it.
- No record breaking scorer.
- No statistical outlier.
- No overwhelming superiority.
Just a team that consistently found small advantages where others gave them away.
But titles are not always won by the team that scores the most goals, dominates the headlines, or produces the most spectacular moments.
Sometimes they are won by a team that relentlessly removes weaknesses.
Sir Dave Brailsford, the architect of British Cycling's transformation, called this philosophy marginal gains. His belief was simple: if every aspect of performance could be improved by just 1%, the cumulative effect would become significant.
"The whole principle came from the idea that if you broke down everything you could think of that goes into riding a bike, and then improved it by 1%, you will get a significant increase when you put them all together."
Arsenal's title-winning season felt remarkably similar.
They did not possess one overwhelming advantage that separated them from the rest of the league. Instead, they accumulated dozens of smaller ones.
- Fewer costly mistakes.
- Better discipline.
- Smarter game management.
- More efficient finishing.
- Stronger defensive control.
Individually, none of these advantages seemed decisive. Together, they were.
What this article covers
- Why Arsenal's 2025-26 title looks more like a process than a performance.
- How a data-driven marginal gains framework explains their consistency.
- Which metrics separated Arsenal from City, Liverpool, and Manchester United.
- What the underlying numbers reveal about discipline, control, and defensive stability.
Data preparation
This article explores whether Arsenal's Premier League triumph can be explained through the lens of marginal gains, and how a collection of small edges over 38 matches ultimately became the difference between contenders and champions.
Data sources
To answer that question, I first had to get the data.
The analysis draws on match-level data for Arsenal, Liverpool, Manchester City, and Manchester United across the entire Premier League season.
- Match logs, shooting statistics, and disciplinary data were collected from FBref.
- Expected-goals data was sourced from Understat.
Together, these sources provided a richer view of performance than league tables, goals scored, or possession statistics alone.
Data cleaning and standardisation
But first, the data had to be collected, cleaned, and made ready for analysis.
The match logs formed the foundation, providing the essentials:
- opponents, scorelines, results, formations, possession figures, referees, and attendance
On top of that, shooting data was added to measure chance creation and finishing efficiency. Miscellaneous statistics captured fouls, cards, interceptions, tackles, and penalties. Finally, Understat's xG data introduced a way to measure performance beyond outcomes, allowing expected and actual results to be compared.
Bringing these sources together proved to be a data engineering exercise in its own right. Team names varied across datasets. "Manchester Utd" became "Manchester United." "Wolves" became "Wolverhampton Wanderers." Even the column structures differed, with team specific fields such as arsenal_goals, mancity_shots, and manutd_yellow_cards making direct comparison impossible.
Before any of it could say anything useful about football, the data had to line up properly.
The match logs became the anchor table. Shooting, miscellaneous, and xG data were merged onto that foundation match by match. Team specific columns were standardised into shared metrics such as team_goals, team_shots, and team_yellow_cards. Merges were validated, naming inconsistencies were resolved, and every record was checked to ensure that all four clubs could be compared on equal terms.
Only then could the football analysis begin.
Because the goal was never simply to compare Arsenal with their rivals. It was to understand why Arsenal finished above them. That meant looking beyond goals and possession to examine:
- shot quality
- defensive efficiency
- discipline
- penalties
- game control
- expected-goal performance
- and ultimately the collection of small advantages that accumulated over 38 matches
The argument that follows is built on that foundation: a season's worth of football data, carefully collected, cleaned, and standardised before a single conclusion was drawn.
Arsenal were not the most entertaining team, they were the most complete.
The easiest way to see the season as a whole is to start with the broadest picture.
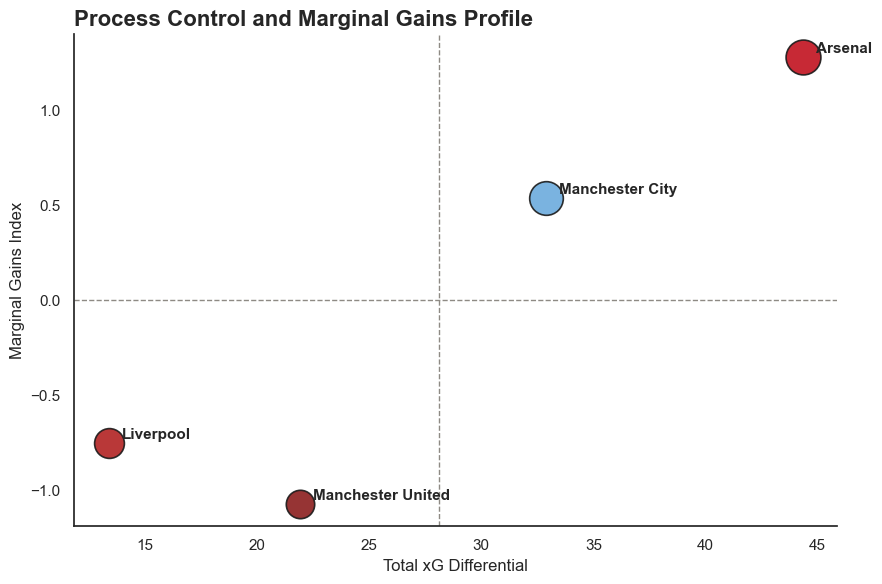
How to read this
The horizontal axis shows total xG differential across the season, the cleanest single indicator in this piece of which teams consistently created better chances than they conceded. The vertical axis shows the Marginal Gains Index, which is designed to capture the broader accumulation of small advantages over a season rather than one standout strength.
Arsenal sit furthest into the top-right corner because they lead on both dimensions. They pair the league's strongest underlying process with the strongest marginal-gains profile. Manchester City are the only side close enough to make the comparison interesting. Liverpool and Manchester United are operating in a different part of the picture.
That matters because Arsenal's title does not rest on one runaway strength. It rests on several meaningful ones all pulling the same way.
- They controlled chances better.
- They conceded fewer avoidable setbacks.
- They kept more clean sheets.
- They put themselves in winning positions more often than the rest.
Over 38 games, those small edges stop looking small.
How the Marginal Gains Index was built
The Marginal Gains Index is a composite matrix built to capture the less glamorous side of season long superiority. Rather than leaning on one raw stat, it combines six indicators that reflect different ways teams gain or lose ground over time:
Component | Why it Matters | Direction |
|---|---|---|
xG Differential | Measures chance dominance | Higher = Better |
Shot Suppression | Limits opposition opportunities | Lower = Better |
Penalties Conceded | Avoids gifting goals | Lower = Better |
Red Cards | Maintains numerical advantage | Lower = Better |
Clean Sheet Rate | Defensive consistency | Higher = Better |
| Controlled Match Rate | Ability to dictate games | Higher = Better |
Because these six measures are on different scales, they were standardized first. Metrics where lower is better such as opponent shots, penalties conceded, and red cards were inverted so that a higher score always means a stronger profile.
MGI = [Z(xGDiff) + Z(ShotSuppression) + Z(CleanSheets) + Z(ControlRate) + Z(-PenaltiesConceded) + Z(-RedCards)] / 6
Next question: How often did Arsenal give opponents an advantage?
Almost never.
Across 38 league matches, Arsenal conceded zero penalties and received zero red cards.
That may sound like a small detail, but title races are often decided by moments of self-destruction.
- A reckless challenge
- A needless dismissal
- A lapse of concentration in the penalty area
Over a long season, those moments cost points.
Arsenal largely removed them from their game.
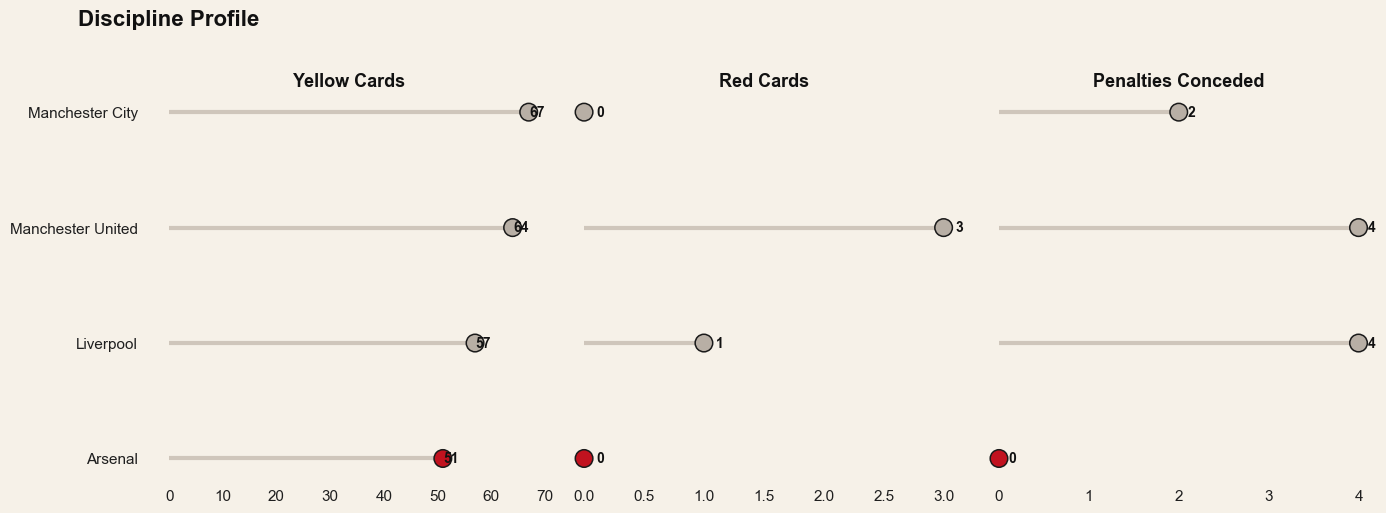
The discipline profile makes the gap clear. Arsenal finished the season with the fewest yellow cards of the four teams, no red cards, and no penalties conceded. Manchester City also avoided red cards, but still gave away penalties. Liverpool and Manchester United were punished more often on both fronts.
None of these numbers wins a title on its own. But together they point to something important: Arsenal consistently avoided giving opponents easy advantages.
That theme appears again and again throughout the data. While other contenders occasionally created problems for themselves, Arsenal spent the season removing them.
- Fewer costly mistakes.
- Fewer disciplinary setbacks.
- Fewer opportunities handed away for free.
Titles are often remembered for moments of brilliance, they are just as often won by eliminating moments of stupidity.
This was control without turning control into a performance
There is a lazy version of this article where everything gets reduced to possession.
Arsenal kept the ball. Arsenal controlled matches. End of story.
But that version breaks down almost immediately, because Manchester City still averaged more possession. If having the ball was the whole argument, City would win it.
They do not.
Arsenal finished with the best xG differential in the group and allowed the fewest opponent shots per match. So this was not possession for the sake of it, it was possession turned into leverage.
That distinction matters. A team can dominate the ball without truly dominating the game. Arsenal were better than that. They were better at turning territory, rest defence, pressure, and chance quality into a season-long edge.
The heatmap strips the story down to the essentials.
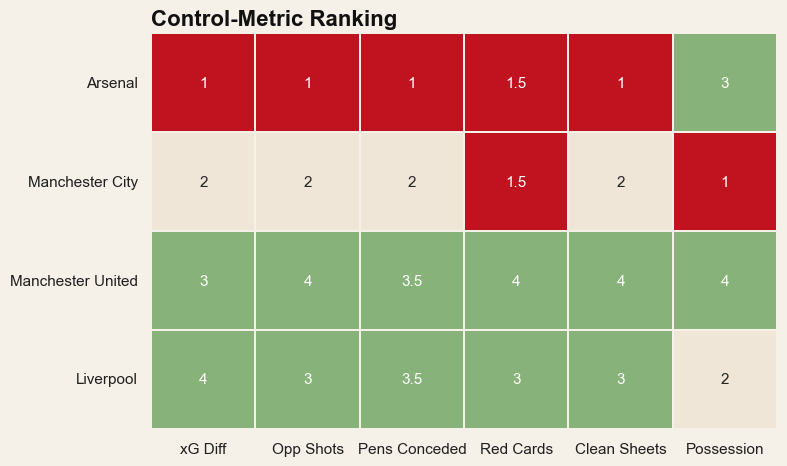
Look at where Arsenal keep appearing:
- xG differential
- opponent-shot suppression
- discipline
- clean sheets
The number that may matter most: 8.16
That is how many opponent shots Arsenal allowed per game, lowest in the group.
It sounds plain. It is not.
A lot of defensive records flatter to deceive. Low goals against can be driven by:
- goalkeeper form
- strange finishing runs
- game state
- or luck
What makes Arsenal's case stronger is that the control begins earlier. They were not just surviving what came at them. They were reducing how much came at them in the first place.
That is the sort of thing that carries across a season. It does not depend on a purple patch from one player or on the randomness of a messy game. It keeps matches smaller and safer.
And once you do that often enough, the clean sheets stop looking accidental. Arsenal finished with 19.
Nobody else got there.
The model did not stay at home
A lot of good teams can look convincing in front of their own crowd. The more revealing question is what happens away from home, when rhythm changes, the game stretches differently, and control has to survive without comfort.
Arsenal's away record is one of the strongest arguments in favour of the whole thesis:
- 2.00 points per game away
- Positive away xG differential
- Strong opponent-shot suppression away
- No away penalties conceded
- No away red cards
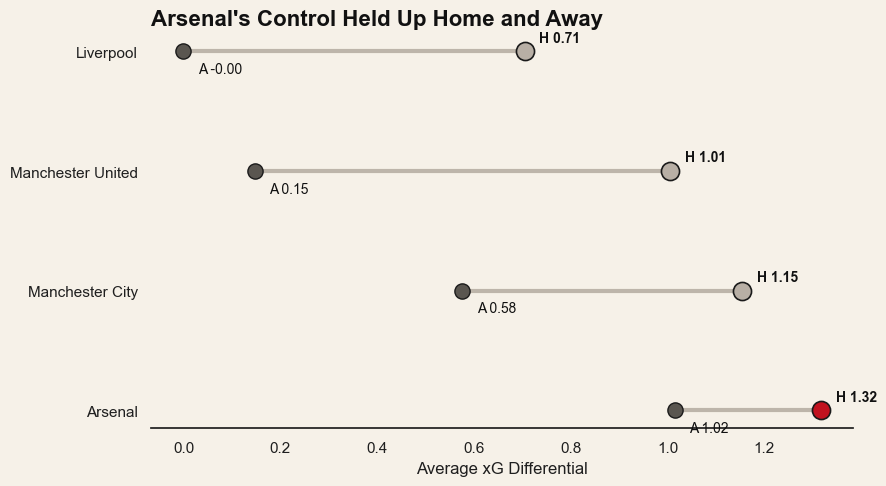
The chart above matters because it shows that Arsenal's season was not built on a home-only illusion. The profile dipped a bit, as every team's does, but it did not change shape. Arsenal still looked like Arsenal.
That is what title winning sides do.
Arsenal were better than their total goal suggested
This is the part that makes the title analytically satisfying.
Arsenal underperformed their attacking xG by 6.49 goals.
In plain English: they scored fewer than the quality of their chances suggested they should have.
That is important, because it suggests Arsenal were not being pushed over the line by unsustainably good finishing. They were, if anything, leaving goals out there.
The process-versus-outcome chart below makes that obvious.
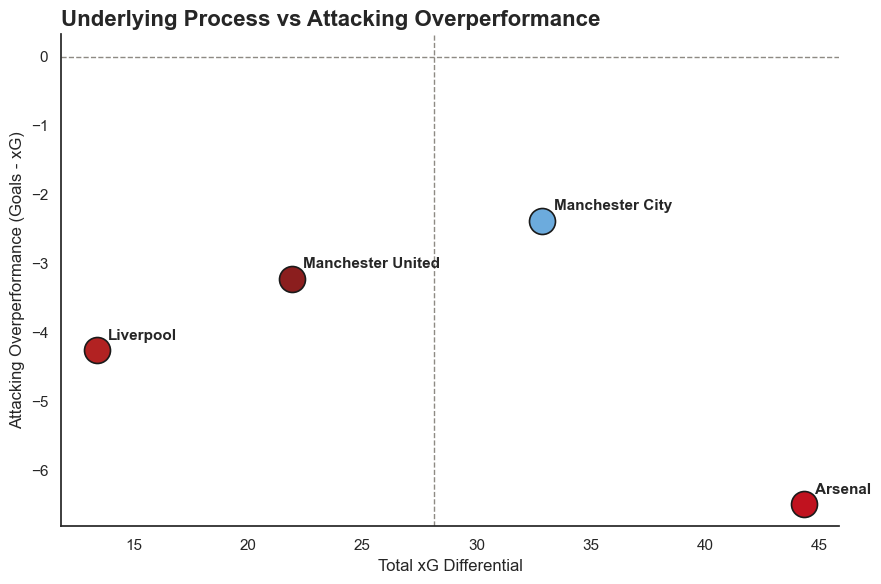
Arsenal sit in the strong-process, low-overperformance zone. That is exactly where a structurally dominant side should sit if the underlying game is doing the heavy lifting.
City are the obvious foil here. They had more possession. They generated slightly more total xG. They also appear to have benefited more from defensive overperformance. Arsenal's season, by contrast, looks cleaner. The process was good enough to stand up even without hot finishing.
That is not a small point. It means this title was built on things that tend to last.
Half the season looked like this: Arsenal on top, game under control
One of the strongest findings in the whole project is not a total, but a match type.
Arsenal produced 19 dominant-control matches. That is exactly half of the league season.
They also had only 4 outplayed matches, the fewest in the set.
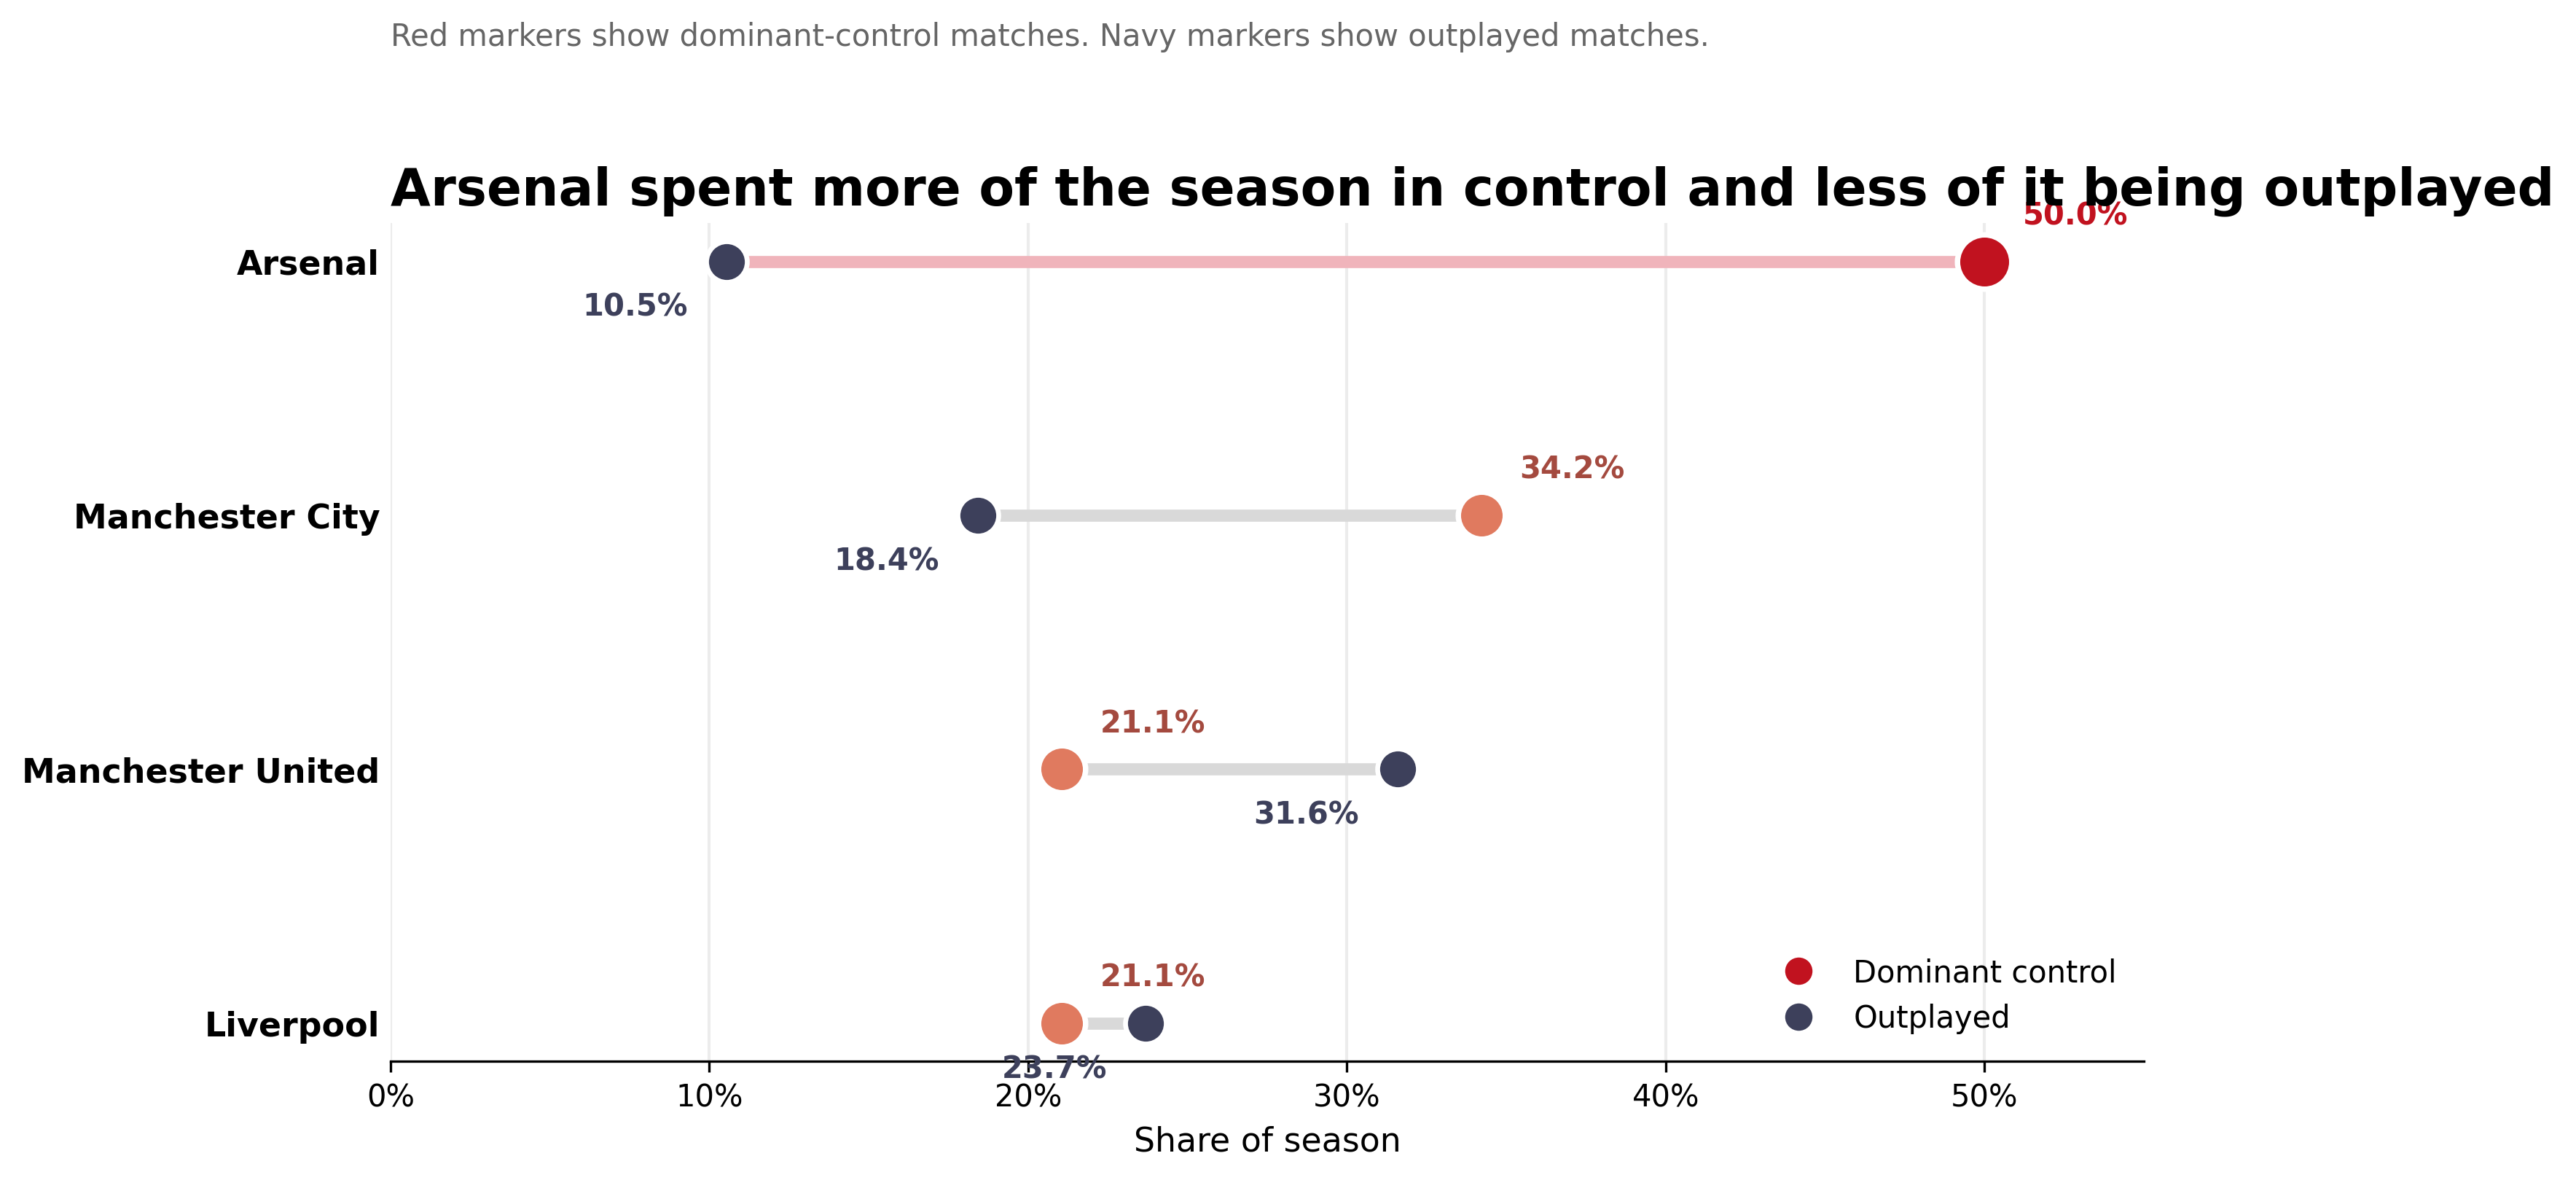
That gets close to the peak of the season. These match types were built from the same questions coaches ask after the final whistle:
- who created the better chances
- who kept the opposition at arm's length
- who kept the game free of needless damage
A dominant-control match, in this piece, is one where a team owned the shot quality, kept the opposition shot count down, and got through the afternoon without the kind of red card or penalty concession that flips a game on its head. Arsenal kept landing in that zone.
So this was not a title run built on nicking results, living off hot finishing, or needing the game to break kindly every other week. More often than not, Arsenal bent matches into the same shape:
- better openings
- fewer scares
- no self-inflicted drama
- no late need for chaos or rescue acts
The gap between Arsenal's dominant-control share and outplayed share is the widest in the group. In football terms, that means they spent more of the season dictating the script and less of it getting dragged into someone else's game. That is why the campaign reads as stable rather than streaky.
Against the best, it looked different
There is a caveat. Against the strongest sides, Arsenal looked a little less like themselves.
This is the one part of the data that pushes back against any claim of complete control. In those matches, the points return dropped, the xG balance tilted slightly the wrong way, and the controlled-match profile that showed up so often across the rest of the season was much harder to find.
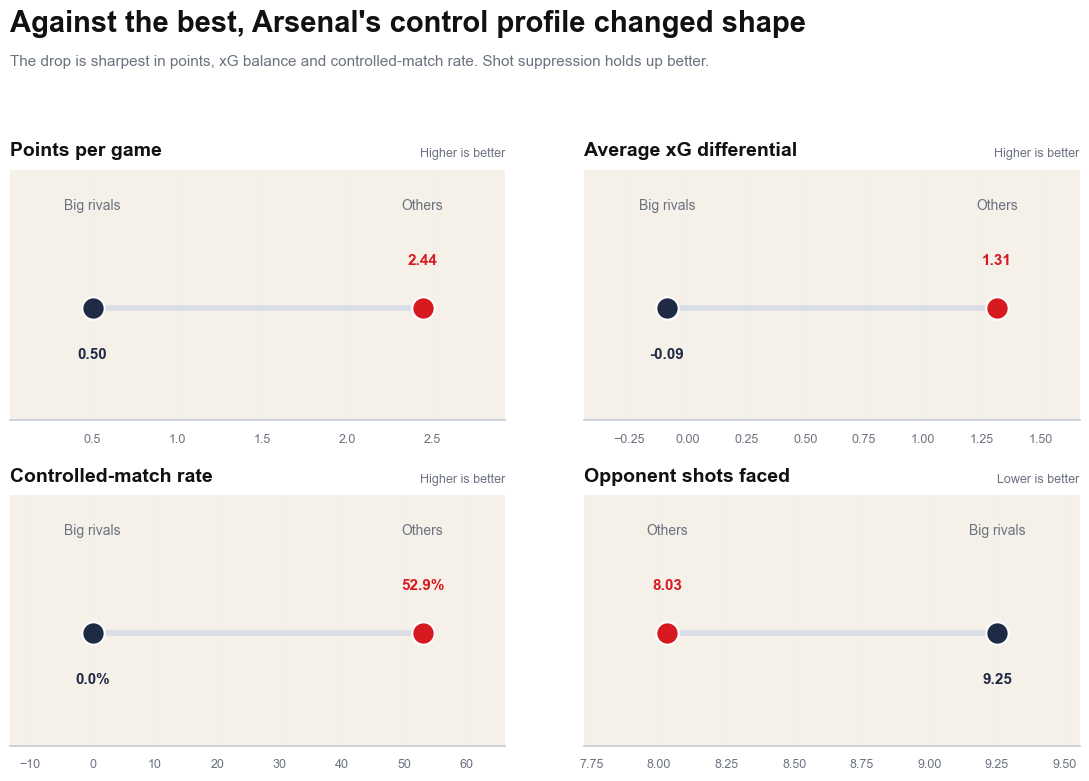
That matters, because title-winning sides are often remembered as if they steamrolled everything in front of them. Arsenal did not. Against the best opponents, they were less able to pin games down, less able to keep them in their preferred shape, and less able to turn control into the kind of familiar afternoon they produced against the rest of the league.
But that is not a weakness in the argument. It is part of what makes the argument believable.
The wrong reading would be that Arsenal were best at everything. The better one is that they built the strongest league-wide model in this group, even if the sharpest end of the fixture list sometimes dragged them into rougher territory.
They did not have to own every heavyweight meeting to win the title. They had to be the side most capable of bending the rest of the season to their own rhythm.
That is what they did.
The distribution is why this feels earned
A season can look commanding in aggregate and still be built on a handful of wild spikes. That is why averages are not enough on their own. The better question is how often a team actually lived in the right part of matches.
This chart gets closer to that.
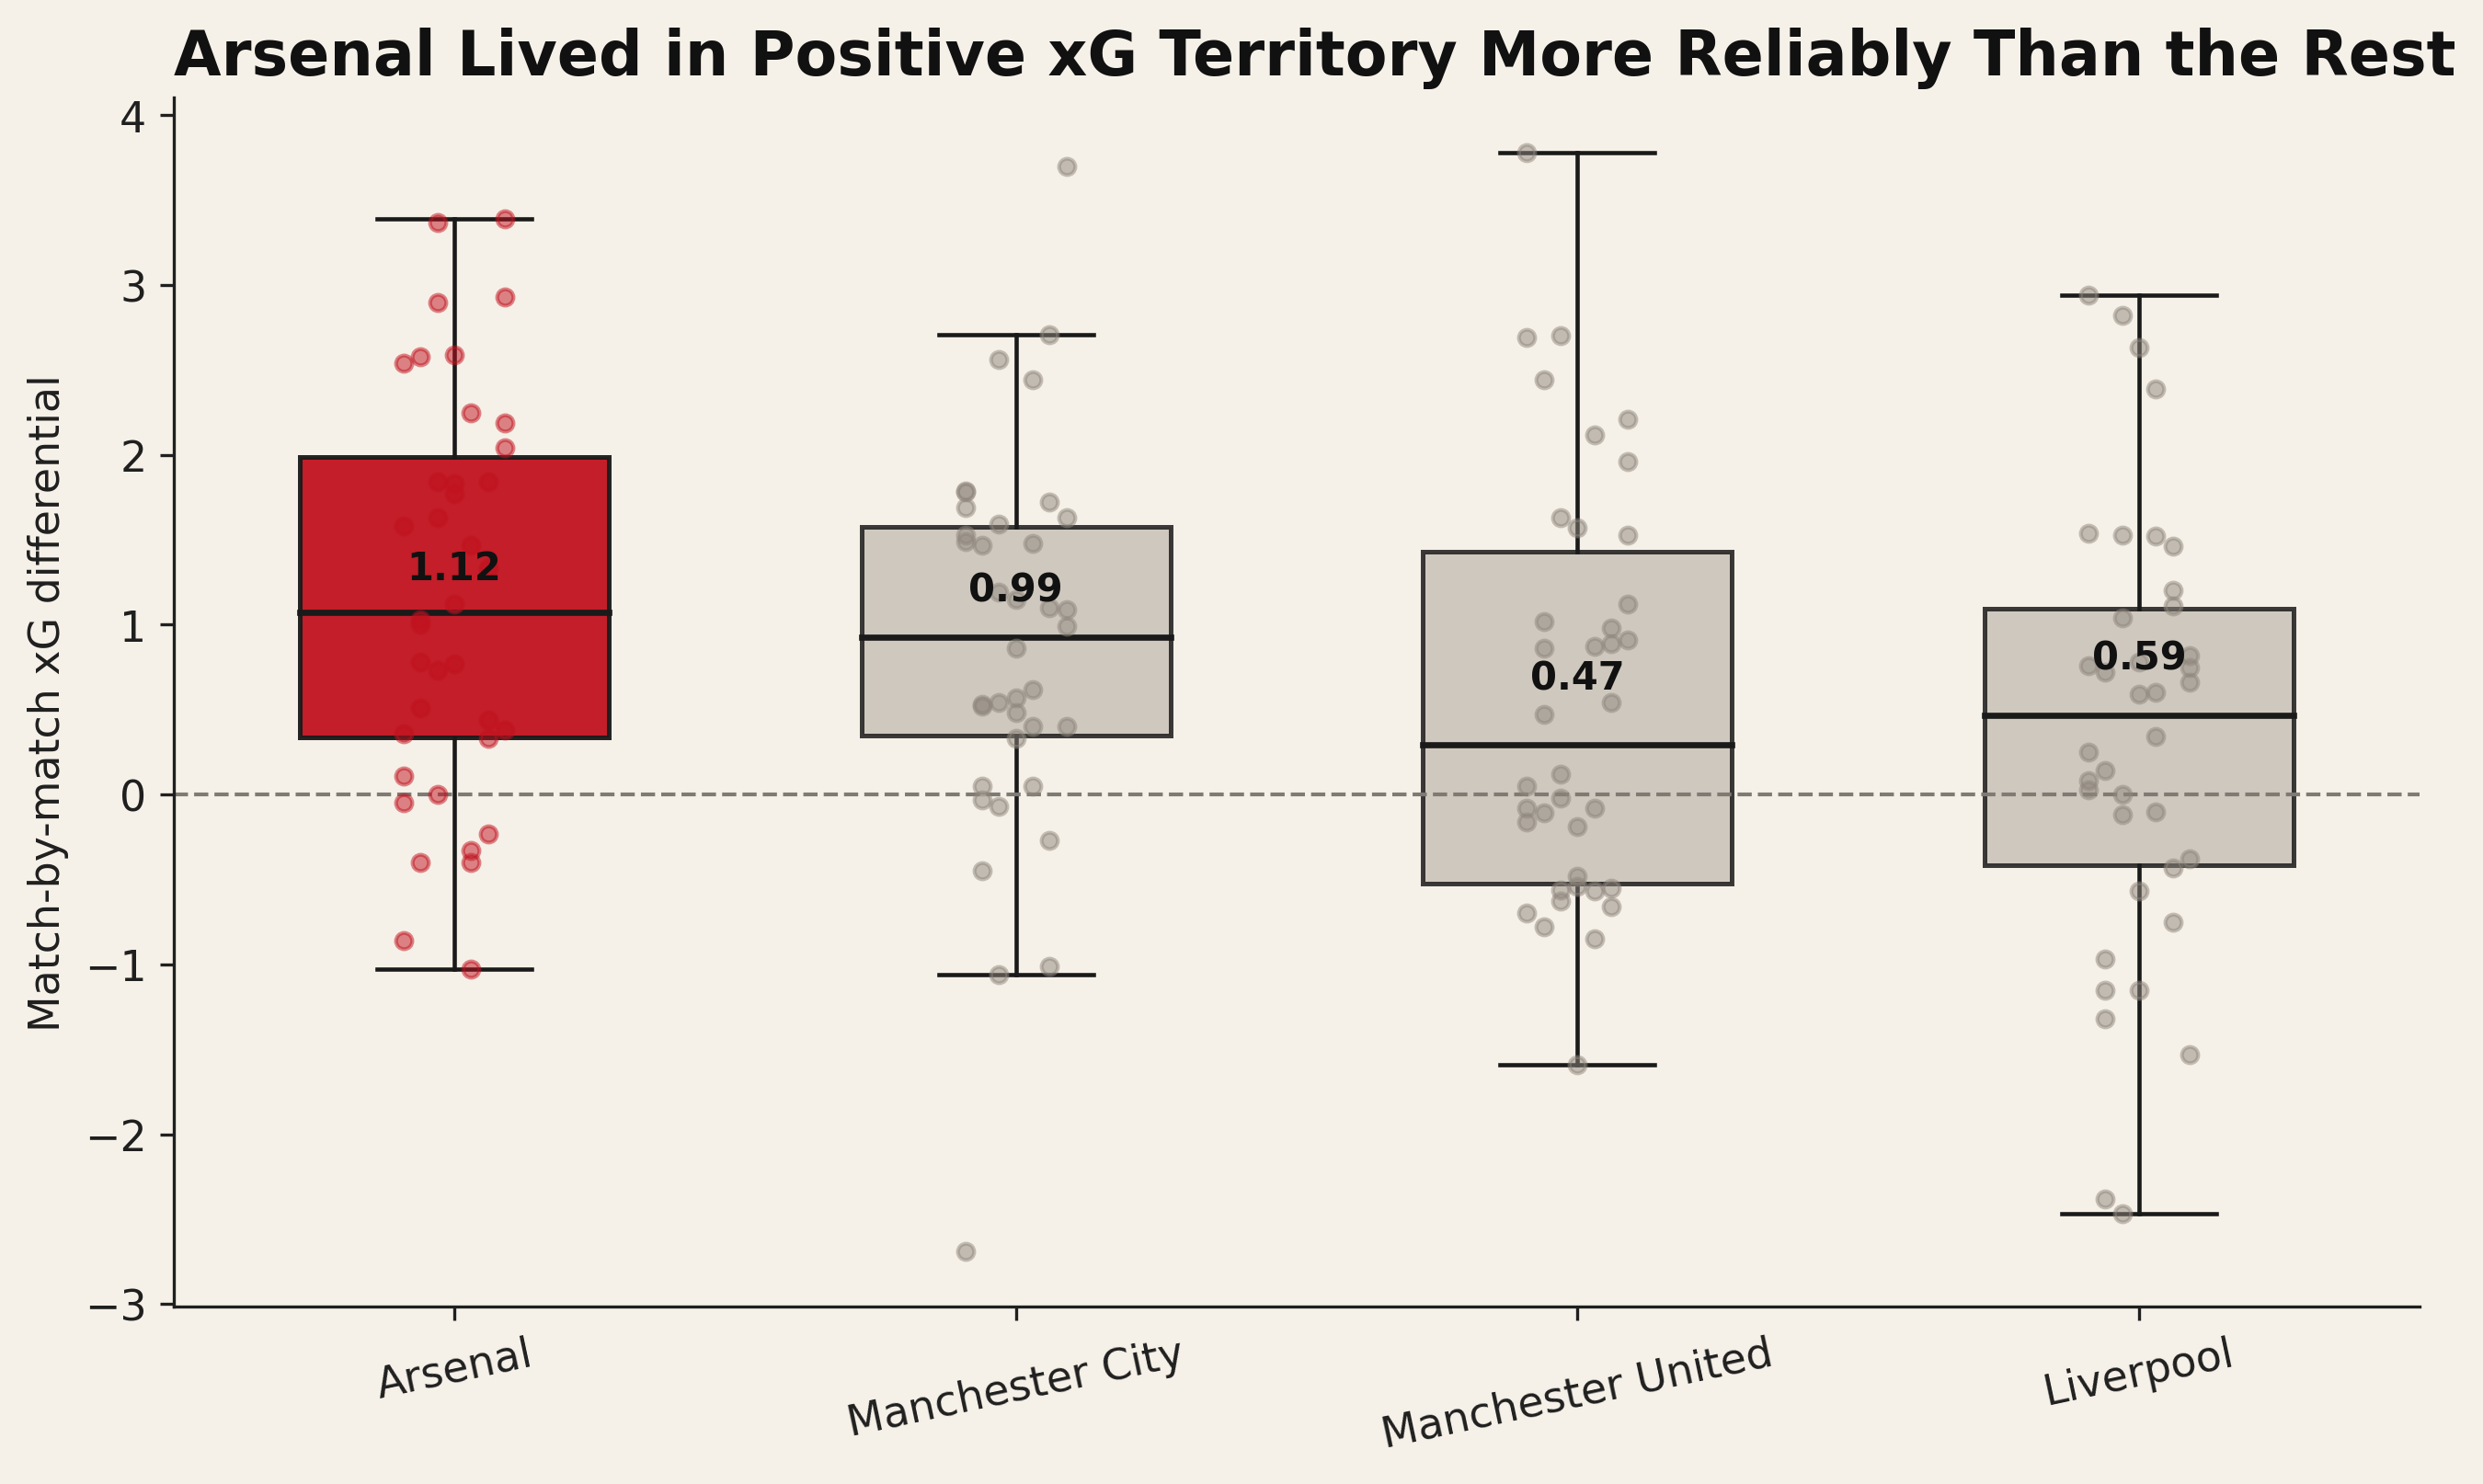
Arsenal's distribution sits where a title-winning process should sit: higher than the rest, with more of their season spent in positive xG territory and less of it dragged into ugly negative space. That does not mean they were flawless. It means the season kept returning to the same underlying reality: Arsenal were usually the side creating the better conditions.
That is why the title looks earned rather than streaky. The shape of the season holds up even when you stop looking at totals and start looking at how often the team actually controlled the game beneath them.
So what actually won Arsenal the league?
It was not:
- one magic ingredient
- one tactical gimmick
- one player turning into a machine for six months
It was the combination of:
- the best xG differential
- the fewest opponent shots conceded
- zero penalties conceded
- zero red cards
- the most clean sheets
- the highest controlled-match rate
- strong away portability
- very little dependence on attacking overperformance
Taken one by one, those things sound manageable. Put them together and they become suffocating.
That is why "marginal gains" is the right phrase, even if it risks sounding sterile. It captures the mechanism. Arsenal did not win the league by flattening every opponent in spectacular fashion. They won it by making the game a little cleaner for themselves, and a little harder for everyone else, almost every week.
Across 38 matches, that is enough to look inevitable in retrospect.
The final point
This title will be remembered first for ending the wait, and it should be.
But it should also be remembered for the kind of side Arsenal were on the way there. Not every champion tears through the league in a blur. Some win by:
- setting the pace of the season
- taking the oxygen out of games
- cutting out the sloppy damage and making the pitch feel smaller for everyone else
That was Arsenal in 2025-26.
They did not need every week to feel wild. They did not need to win the league in a shower of chaos and noise. They won it by making strong performances feel ordinary, by turning control into habit, and by leaving opponents with too little room to breathe.
Not the loudest team.
Just the strongest one.
Sources and References
- FBref: match logs, shooting data, and miscellaneous disciplinary/team statistics for Arsenal, Liverpool, Manchester City, and Manchester United across the 2025-26 Premier League season. https://fbref.com/
- Understat: expected-goals data used to build xG, xGA, and xG-differential comparisons. https://understat.com/
- Arsenal.com: lead image credit. https://www.arsenal.com/
Method note
The dataset for this article was built by collecting match-level records from FBref and Understat, aligning team and opponent naming across sources, and merging the tables into one comparable season file. Team-specific columns were then standardised into shared fields such as team_shots, team_yellow_cards, and opponent_shots so that all four clubs could be analysed on the same terms.
About the author
I help teams in fintech, Banking & Finance, and energy build and scale data systems that work in production from pipelines and analytics to models that support real decisions. This blog is where I share practical lessons from that work.
- Say hi: Connect on LinkedIn: I'm always open to conversations about data, analytics, and engineering.
- Consulting: I take on selective work helping organizations build and scale data platforms in Africa and similar markets. If you need a partner on architecture, delivery, or analytics, email me or visit the contact page.